Here below are useful facts and figures around private schools and education, mostly focused on the UK. Each fact has been checked against academic sources.
We are always looking to increase the information available here, and are working on new sections covering the following; single sex schools; private tuition; inspection regimes; private school membership associations; faith schools and private schools and special educational needs and disabilities.
1. HOW MANY CHILDREN IN THE UK ARE AT PRIVATE SCHOOLS?
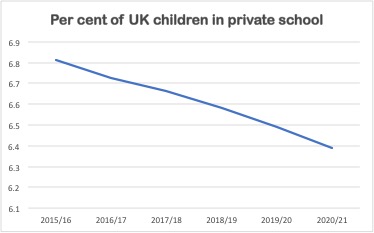
- In England, the proportion of school pupils at private schools, while broadly stable for decades, has been declining slowly in recent years, reaching 6.4 percent in January 2021. This amounted to 569,000 pupils.
2. WHO GOES TO PRIVATE SCHOOL?
By family income:
- The large majority (around 87%) of pupils at private schools come from parents who are business owners, or have professional and managerial backgrounds. The proportions have not changed much for a long time.
- The below table shows the proportions of pupils according to family background.
FAMILY BACKGROUND 2004 2014
Managerial & professional 77% 78%
Intermediate occupations 5% 6%
Small Employers 7% 9%
Routine and manual occupations 6% 4%
Not working/unknown 5% 3%
(Source: Analysis of Next Steps Survey for 2004, Millennium Cohort Study wave 6 for 2014.)

Fig 1. Percentage in private school at each rung of the income ladder
(Source: Data from Family Resources Survey; see Green, F., J. Anders, M. Henderson and G. Henseke (2017). Who Chooses Private Schooling in Britain and Why? London, Centre for Research on Learning and Life Chances (LLAKES), Research Paper 62.. The base population is all children aged 5-15 living in private households in Great Britain, between 2001/2002 and 2015/2016. The income rungs are the percentiles of their families’ gross weekly income.)
Age phase:
- At the primary stage, 5 percent of pupils attend private schools.
- At the secondary stage, 8 percent of pupils attend private schools.
- Of those in sixth forms, 17 percent of pupils attend private schools.
Boarders:
- About 13% of pupils in private schools UK-wide are at boarding schools.
- Boarding is most common in the South West of England (around 1 in 4 private school pupils), and least common in Greater London (just 3%).
Foreign pupils:
- Excluding international schools, about 5% of private school pupils are non-British with parents living abroad. The largest group are from China (both mainland and Hong Kong).
- Another 5% are non-British but with parents who live in Britain.
3. WHO GETS BURSARIES AND SPONSORSHIPS?
- Only 1 percent of private school pupils receive full means-tested support and pay no tuition fees.
- Only 7 percent of private school pupils receive a means-tested bursary or scholarship.
- 33.8% of private school pupils receive some fee assistance from their school (in most cases) or elsewhere. These aren’t limited to those who may otherwise be unable to pay, and includes scholarships and discounts, for example for pupils displaying excellence in certain subjects, for children of staff, or for pupils with siblings already at the school.
- The proportion spent on bursaries is only 4 percent of turnover.
- Meanwhile, there were only 25 academy sponsorships by ISC schools, excluding via a federation (down from 27 the previous year).
- The ISC states 75 percent of its schools were in a partnership activity with state schools during 2022. A 2023 PEPF study found many of these partnerships to be superficial in nature and/or unevaluated in impact.
4. WHAT IS THE GAP IN RESOURCES FOR PRIVATE AND STATE SCHOOL PUPILS?
- The private-state resources gap is approximately 3 to 1 on average. In other words, a privately-educated pupil will have three times the amount of money spent on their education as a pupil in a state school.
- The pupil-teacher ratio is 8.5 to 1 in ISC schools, less than half the ratio in state schools, which is 17.9 in England. In other words, a privately-educated pupil will have double the number of teachers as a state-educated pupil.
(While private school fees continue to rise ahead of inflation, per capita resources in the state sector have fallen since 2015. Therefore, the resource gap is probably rising – though a caveat is that statistics on private schools’ resources are scarce.)
5. WHAT ARE THE FEES?
- Fees have risen by an average of 6.6% every year over 2000 to 2010, and by 3.9% every year over 2010 to 2019.
- Since 1980, fees rose by more than a factor of three in real terms after allowing for inflation. In 1980, average fees were 20% of median household income; by 2014, fees were 50% of median household income.
The average school fee in Independent Schools Council (ISC) schools (which covers most but not all private schools) in 2021, was (before extras and excluding nursery school fees):
- Boarding pupil: £36,000
- Day pupil in boarding school: £20,586
- Day pupil in day school: £15,192
Fees vary considerably; for example, the day pupil average fee ranges from £18,108 in London to £8,175 in Yorkshire and Humberside.
6. WHAT ABOUT CHARITABLE STATUS?
Of private schools affiliated in 2020-21 to the ISC:
- 985 schools (72%) are registered charities
- 339 (22%) are profit-making
Meanwhile, all state schools must pay normal business tax rates to their local authority, which can amount to hundreds of thousands of pounds per school a year.
A 2017 analysis of 582 private schools suggested they didn’t have to pay £522 million in taxes over five years because of their tax relief status.
Eton College (see its Charities Commission page here) alone would have had to pay an extra £4.1 million.
- However the ISC, in a study by Oxford Economics, estimates it saves the taxpayer £3.5 billion every year by educating pupils outside the state (not £20 billion as The Times wrongly claimed, see Full Fact article here). In other words, this it what it would cost the state to educate all the pupils currently in the private school sector.
- To put this £3.5 billion figure in context, in 2017-18 the government spent £39 billion on the state schools budget. That still only made up 58% of total government education spending in England.
7. WHAT IS THE ‘EFFECT’ ON ACADEMIC OUTCOMES OF GOING TO A PRIVATE SCHOOL?
At each stage of school education – primary, lower secondary and upper secondary (sixth form) – those at private school achieve modestly better academic outcomes, even after allowing for their family backgrounds and prior achievement. There are currently 14 studies that have found a private school advantage.*
- For those educated at private primary (i.e. “prep”) schools in the 1980s, reading and maths scores were significantly greater than for those educated at state primary schools.
- For those educated at prep schools in the 2000s, reading scores were significantly greater than for those educated at state primary schools.
Cumulatively, the advantages build up through young people’s time in education. The consequence is that the privately educated enter work life with better qualifications. Thus, comparing only among those from professional or managerial backgrounds:
- Many more privately educated people obtain university degrees than state-educated pupils (85% compared with 67%);
- Twice as many (24% compared with 12%) obtain degrees at a ‘Russell Group’ university
- An average of 43% of offers from Oxford and 37% from Cambridge were made to privately educated students between 2010 and 2015.
- However, these proportions have decreased in recent years. Between 2015 and 2020, the University of Cambridge’s state school intake increased from 62.3% to 70%. Cambridge’s intake is 1.3% higher than the University of Oxford.
However, some studies have shown that once at university the advantages cease (and if anything are slightly reversed). One found that on some measures state pupils were significantly more likely to get a 2:1 than their private school peers.
8. WHAT IS THE DIFFERENCE IN EARNINGS IN LATER LIFE OF PRIVATELY EDUCATED PUPILS?
- Those who attended fee-paying schools earned £4,500 more than those from state schools, three years after graduating, according to research.
- Salaries of privately-educated people also increased more quickly, growing by £3,000 more over the same three-and-a-half year period.
- The research said half of this difference can be explained by factors such as prior academic attainment and type of university, but the remaining half is not explained by academic factors and is likely to be down to articulacy, assertiveness and other soft skills.
- Privately educated pupils are likely to earn almost £200,000 more between the ages of 26 and 42 than those from state schools, according to another report.
9. WHAT PROPORTION OF ADULTS IN PROFESSIONS AND POLITICS WERE PRIVATELY EDUCATED?
- 65% of senior judges; 52% of junior ministers; 52% of diplomats; 49% of senior armed forces; 45% of public body chairs; 44% of national news columnists; 43% of male international cricketers; 20% of pop stars; and 16% of university vice chancellors attended private school.
- At the time of research, 29% of MPs were from a private school background, a figure which has been decreasing over time as more state-educated MPs enter the Commons.
- The House of Lords is less representative, with 57% of its members educated privately. This figure is actually 8 percentage points higher than 2014.
- In current prime minister Boris Johnson’s cabinet, the proportion of privately-educated ministers is twice as high as Theresa May’s 2016 cabinet – at 64% compared to 30%. In David Cameron’s 2015 cabinet, the rate was 50%.
Of course, these statistics effectively “look backwards” in time because many of those in top positions now would have been at private school several decades ago.
10. HOW MANY ADULTS HAVE BEEN PRIVATELY EDUCATED?
- Roughly 9% of the British adult population have been, at some time, at a private school.
- This proportion is greater than the proportion of current school children in private education, because many switch between the sectors at different stages of their school careers.
11. WHERE ARE THE SCHOOLS?
Private schools are all over Britain. However, their density varies:
- England’s private schools are disproportionately concentrated in London and in the South East region. They are also concentrated within London, where in some boroughs – Richmond-Upon-Thames, Camden and Westminster – more than three in ten schools are independent.
Scotland’s schools are concentrated disproportionately around Edinburgh.
12. HOW MANY PRIVATE SCHOOLS ARE THERE?
- There were 2,366 private schools in England in January 2021, up from 2,331 in 2019-20. See gov.uk here.
- These were 9.7% of all schools in England.
- Only 1,364 of these schools are affiliated to the Independent Schools Council (ISC); however, these ISC-affiliated schools educate about 85% of all private school pupils.Fig. 2 Share of private schools and pupils in England in the 21st Century

* Data health warnings:
a) Each young person is unique: the above findings are only averages across the population.
b) While studies take account of the differences in socio-economic background between private- and state-educated people and in their prior achievements, there are no random controlled tests or similar experimental evidence of causal effects.13.
13. INTERNATIONAL PRIVATE SCHOOLS
Overview
- The division between public and private schools is blurred with many countries having semi-privatised public schooling alongside state schools andfully independent schools.
- PISA distinguishes between two types of school within the private school sector. “government-independent private schools” are those funded mainly through fees or other private contributions whilst “government-dependent private schools” are privately managed schools that receive more than 50% of their funding from government sources. Academies in the UK and charter schools in the US are examples of this sector.
- Private schools globally also encompass a wide range of schools from local elite establishments, International Schools, British (or American or French etc.) Schools and “low fee private schools”.
- On average across OECD countries 18 per cent of students attended a private school. 5 per cent of students were enrolled in government-independent private schools and 13 per cent of students were enrolled in government-dependent private schools in 2018.
- The proportion of students enrolled in public schools across OECD countries has remained stable over the last 20 years. However, World Bank figures show a global rise from 19.21% in 1998 to 26.9% in 2019 of pupils attending a private secondary school.
- In countries classified by the United Nations as “least developed” the proportion rises to 34 per cent. Meanwhile Unicef reports that underinvestment in education in low-income countries by the public sector results in households’ paying for – on average – 27 per cent of the cost of their children’s education.
- In 53 out of 66 countries with available data pupils attending private schools were more advantaged than that of those who attended public schools. Large differences in socio-economic profile between private and public schools have not changed in recent years.
- Countries with a larger share of private schools do not perform better in PISA measures.
The cost of international private education
- The value of the education market, globally speaking, was estimated at $4.9 trillion in 2015.
According to the International Schools Database:
- Asia is the most expensive region for international education. 5 of the 10 cities with the most expensive international school fees in the world are located in Asia.
- Africa is by far the most affordable continent for international schooling.
- Europe has the widest range of international school fees in the world.
- Fees for International Private Schools range from at their lowest in Kampala at $619 per year to $58700 per year at their most expensive in New York City.
- Average median International School fees in the Americas 2020 – $19,176 per year
- Asia’s average median International School fees in 2020 – $16,157 per year
- Europe’s average median International School fees in 2020 – $12,209 per year
- Average median International School fees in the Middle East 2020 – $8,521 per year
- Africa’s average median International School fees in 2020 – $6,295 per year
Countries with the highest proportion of fee-paying schools
The OECD countries with the highest rates of enrollment in government-independent private schools are:
- Qatar 41.2%
- United Arab Emirates 38.2%
- Japan 30.1%
- Peru 24.6%
- Lebanon 20.4%
Countries with the lowest proportion of fee-paying schools
According to the OECD the following member countries have the lowest rates of enrollment in government-independent private schools:
- Azerbaijan 0%
- Finland 0%
- Hong Kong 0%
- Iceland 0%
- Montenegro 0%
British & International schools overseas
- Globally, the market for international private schools — defined as those offering instruction primarily in English and with an international orientation — now totals more than 11,500 schools around the world with enrollment of about 5.8 million students.
- 4,000 of these are British international schools, teaching a variant of the UK national curriculum.
- Franchised ‘satellite colleges’ of (mostly) British Private Schools are experiencing an unprecedented growth: growing from 37 in 2014 to 73 in 2019. They educate 45,000 children, with an annual fee income of £1bn. It was reported in May 2019 that the UK Department for International Trade is aware of at least 120 overseas projects being considered by British-based private schools.
- Under domestic pressure regarding their charitable status, some schools use the satellite college model as a means of generating a revenue stream to finance bursaries and scholarships in the UK.
- In COBIS affiliated schools Covid-19 has had an impact on pupil numbers. 46 per cent of schools reported a decrease in pupil numbers. 54 per cent of schools indicated pupil numbers had increased (32 per cent) or stayed the same (22 per cent).
- 66 per cent of schools attribute the change in pupil numbers wholly or partly to Covid-19. However, in 2019, 79 per cent of responding schools indicated that student numbers had increased over the past three years.
- COBIS schools perform strongly at A-Level compared with the UK average, with an 18.9 per cent higher A*/A pass rate, a 16.4 per cent higher A*/B pass rate and a 6.8 per cent higher A*/C pass rate.
- COBIS schools perform strongly at GCSE/IGCSE compared with the UK average with a 26.2% higher A*/A (9-7) pass rate and a 19.1% higher A*/C (9-4) pass rate
‘Low fee private schooling’
- LFPS are defined as private schools that have been set up and are owned by an individual or group of individuals for the purpose of making a profit, and are supposed to be ‘affordable’ for low-income families.
- LFPS are a growing phenomenon in sub-Saharan Africa (with Malawi, Nigeria, Kenya and Ghana referenced most frequently), South Asia (India and Pakistan) and Latin America (Peru, Centre-America)
- It is hard to generate accurate data as many LFPS are not regularised and, accordingly, are not properly documented in administrative records.
In England, James Tooley has set up a ‘low fee private school’ called The Independent Grammar School Durham. Fees for the academic year 2021/2022 are £3,300 per year, or £63 per week.
